Main page
-
Main Page Overview
The Main Page is your dashboard, providing a quick overview of your account details, subscription limits, and traffic performance. Here’s what you’ll find:
Active Modules & Subscription Limits:
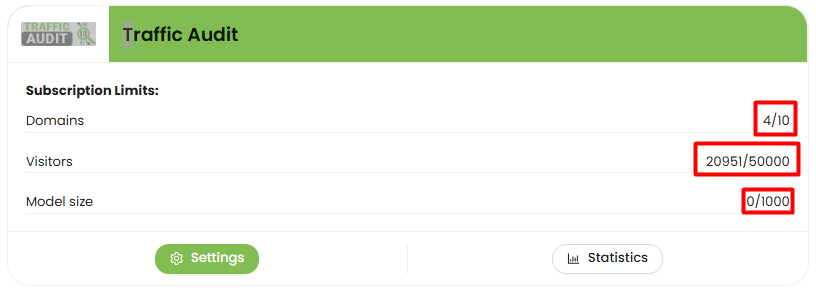
On the Main Page, you can view all active modules linked to your account, along with the limits of your current subscription plan and the percentage already used. Your plan limits are displayed numerically so you can easily monitor your usage. For example:
Traffic Audit
- Number of domains you can analyze
- Number of visitors that can be audited
- Maximum AI model size for traffic analysis
- Number of Google Ads accounts connected
- Number of visitors tracked in Google Ads
- Maximum AI model size for Google Ads analysis
Google Ads Audit
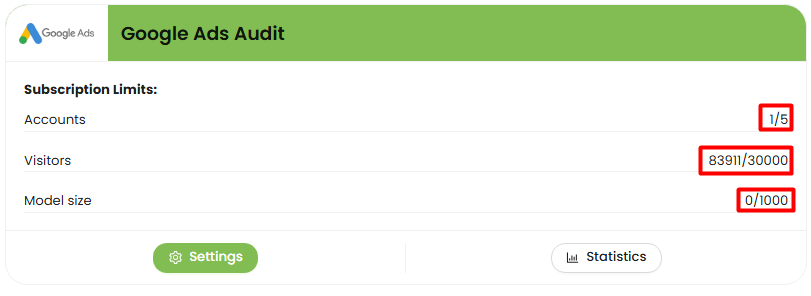
From here, you can also jump directly to the Settings or Statistics of each module with a single click.
-
Monthly Report:
The Monthly Report section provides statistics for your entire account (across all domains) over the past 30 days, including:
- Total clicks
- Conversions
- Fraud (number of fraudulent clicks)
- Fraudulent clicks (count)
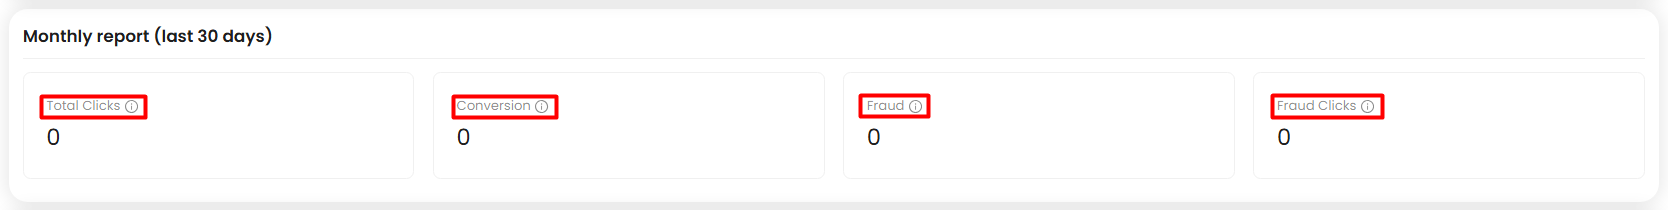
This helps you quickly understand overall performance and the impact of fraud on your campaigns.
-
Charts & Analysis Options:
In each module, you’ll find charts that visualize your data for the period you choose. You can filter what’s shown by selecting:
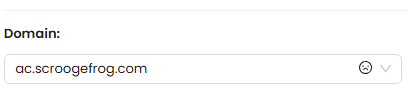
Domain
- Happy face — active traffic
- Unhappy face — no traffic for more than a week
- Stop sign — no traffic at all
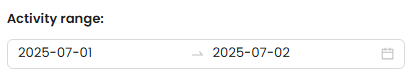
Activity Range
Choose the time period for your analysis.
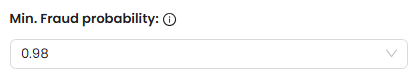
Minimum Fraud Probability
Set the threshold for marking clicks as fraudulent (range: 0 to 1).
For example,a recommended threshold of 0.98 means that clicks with a 98% or higher probability of fraud will be flagged as fraudulent.
Minimum Suspicious Probability
Define the threshold for marking clicks as suspicious (range: 0 to 1).
Example: A recommended value of 0.9 means clicks with at least 90% suspicious signs are flagged as suspicious.
Suspicious clicks fall between the suspicious threshold and the fraud threshold.
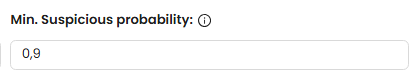
If both thresholds are configured incorrectly (for example, if the suspicious threshold is greater than or equal to the fraud threshold), suspicious clicks will not be displayed.
Metrics:
You’ll see two key charts displaying metrics across all domains and modules:
- Left chart — shows daily results for the past week. Hover over each day to view detailed statistics.
- Right chart — compares fraudulent traffic versus quality traffic as a percentage of total clicks over the past week.
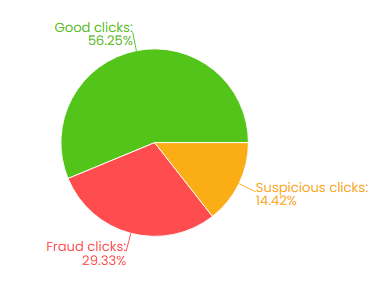
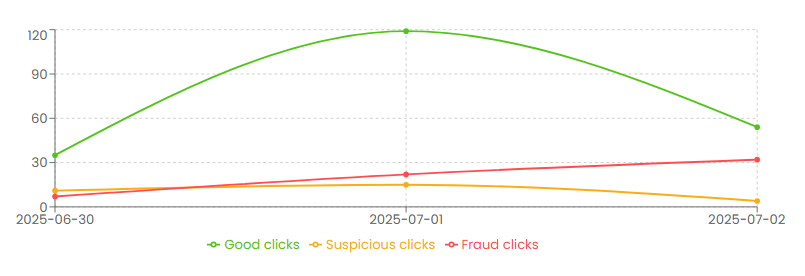
The metrics displayed include:
- Total clicks
- Fraudulent clicks
- Suspicious clicks
This provides a clear, at-a-glance breakdown of your traffic quality and fraud levels.