Statistics
-
To get started with the Statistics module, apply filters to display data relevant to your traffic analysis.
Filters:
- Select the Domain from the dropdown list.
- Set the Activity range to define the time period.
- Optionally enter a value for Min. Total clicks.
- Choose the Sort order (drag to prioritize UTM parameters or other fields).
- Check “Show conversions only” to display conversion-related traffic only.
- Set Min. Fraud probability — filter out low-risk clicks.
- Set Min. Suspicious probability — highlight potentially risky activity.
Once configured, click “Filter” to apply settings or “Save order” to reuse this configuration later.
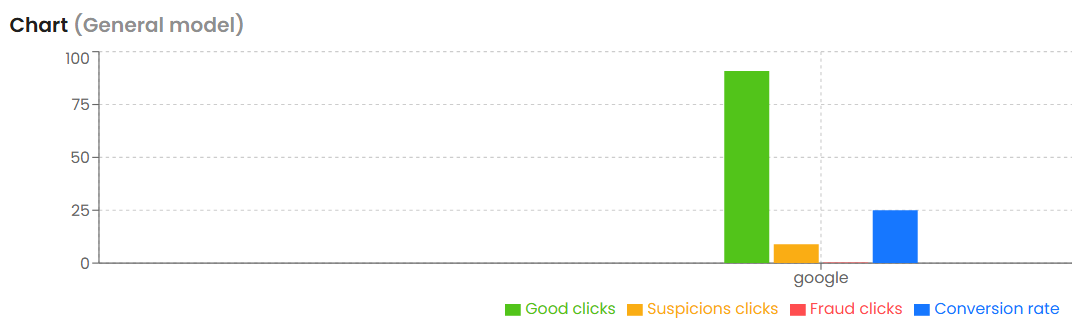
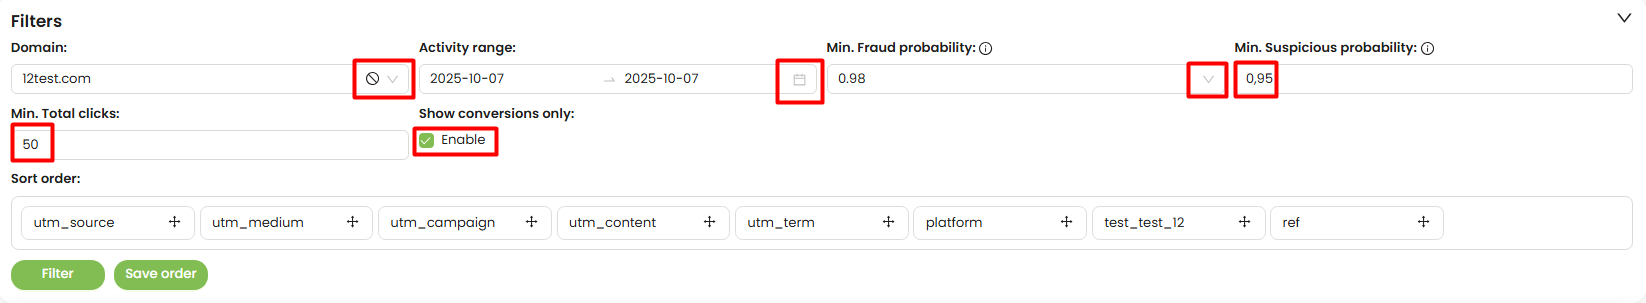 Chart:
This section visualizes data based on the filters you apply. It helps assess traffic quality and behavior at a glance:
- Good clicks — legitimate, high-quality traffic (green)
- Suspicious clicks — questionable interactions (orange)
- Fraud clicks — flagged as fraudulent (red)
- Conversion rate — visual metric showing effectiveness (blue)
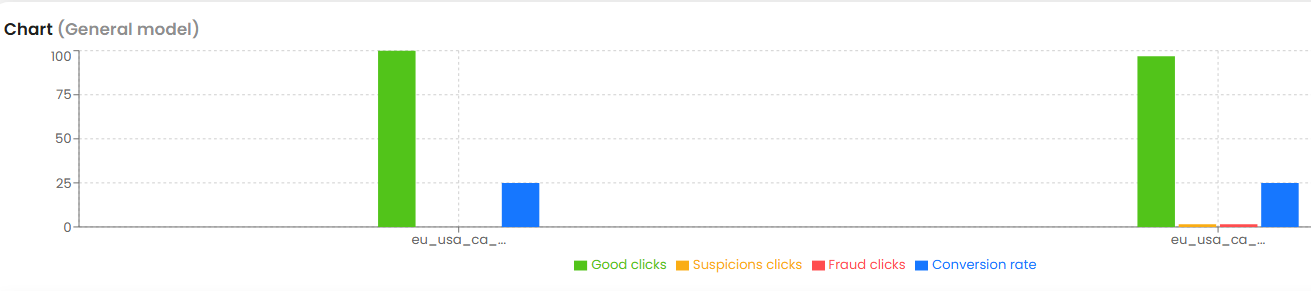
The chart supports drill-down navigation and can be collapsed for convenience.
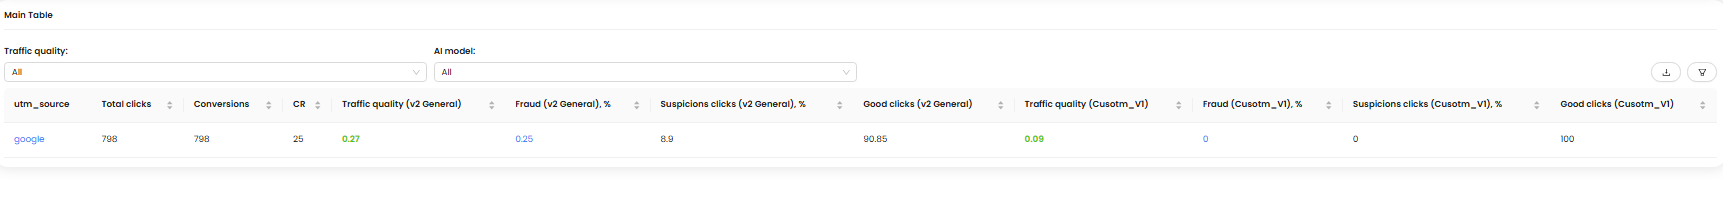
Main Table:
The data table shows detailed results processed by AI models for fraud detection and traffic scoring.
Each row is clickable, giving you access to a breakdown of the source’s performance and risks.
Main displayed parameters:- utm_source — traffic source (e.g., Google, Facebook, etc.)
- Total clicks — total number of interactions/clicks
- Conversions — completed user actions (e.g., purchases, signups)
- CR (Conversion Rate) — percentage of conversions per total clicks
- Traffic quality — scoring based on AI assessment (V2 General or Custom V1)
- Fraud, Suspicious, and Good clicks — traffic distribution across categories
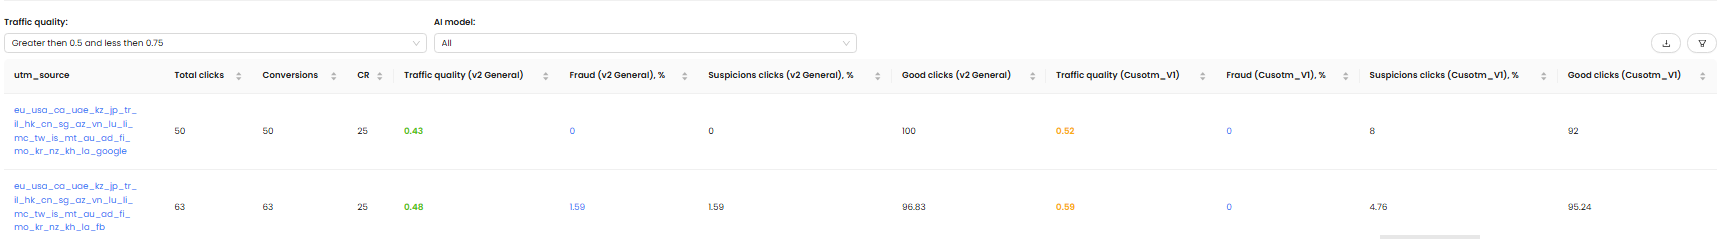
The table includes sorting options, rows-per-page configuration, and full drill-down capabilities.
Use this data to make informed decisions such as pausing campaigns, blocking sources, or updating whitelists.
-
To start analyzing your Google Ads traffic in the Statistics module, apply filters to focus on the data most relevant to your goals.
Filters:
- Select a Domain from the dropdown list.
- Set the Activity range to define the time period for analysis.
- Optionally enter Min. Total clicks to filter out low-volume sources.
- Use Sort order to prioritize fields such as UTM parameters or platform data.
- Enable “Show conversions only” if you want to display only traffic that resulted in conversions.
- Adjust Min. Fraud probability to exclude traffic with low risk of fraud.
- Adjust Min. Suspicious probability to focus on potentially risky traffic.
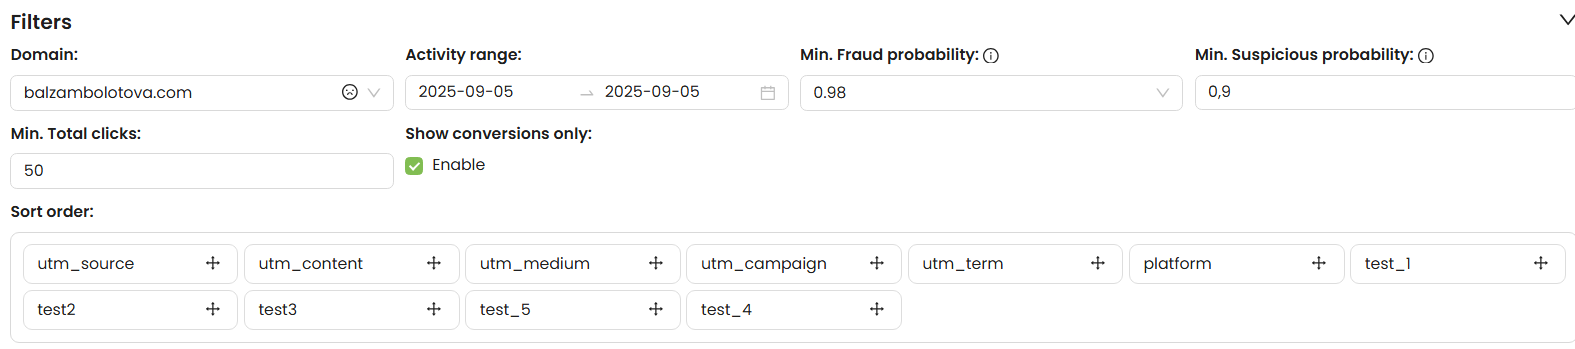
After setting your preferences, click “Filter” to apply or “Save order” to store the configuration for future use.
Chart:
This chart provides a visual overview of traffic quality and conversions based on your selected filters.
- Good clicks — legitimate, high-quality traffic (green)
- Suspicious clicks — potentially irregular or doubtful traffic (orange)
- Fraud clicks — traffic marked as fraudulent by the AI model (red)
- Conversion rate — displays conversion performance (blue)
The chart can be collapsed or expanded for a clearer workspace.
Main Table:
The main table displays detailed analytical data processed by AI models for fraud detection and traffic scoring.
Each row represents a traffic source and can be clicked to open deeper insights about its performance and risk distribution.
Displayed parameters include:- utm_source — traffic source (e.g., Google, Facebook, etc.)
- Total clicks — total number of user interactions
- Conversions — completed user actions (such as purchases or signups)
- CR (Conversion Rate) — percentage of conversions relative to total clicks
- Traffic quality — AI evaluation score (V2 General or Custom V1)
- Fraud, Suspicious, and Good clicks — breakdown of traffic categories
Use this data to take action — pause or optimize campaigns, block fraudulent sources, or adjust your whitelists for better performance.